")
")
Earned Value Analysis (EVA) is a powerful instrument for project controlling. The following key figures describe the schedule and cost situation of a project at time point x.
- Planned Value (PVx)
- Actual Costs ( ACx)
- Earned Value (EVx)
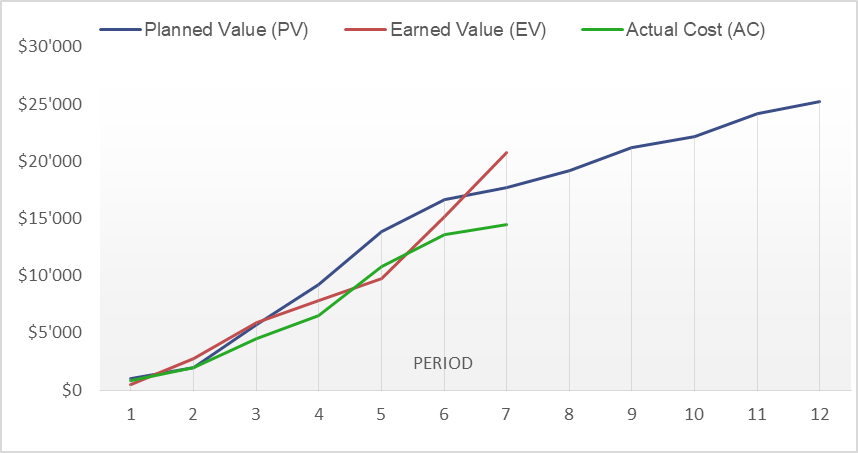
By tracking these metrics, a trend analysis can be created that is mainly used in waterfall projects, but is also an interesting progress control tool for agile projects, as we will see later. See below an example of an EVA chart
The starting point for the EVA is the financial estimate of the project scope or the resulting work packages as planned in a Work Breakdown Structure (WBS), for example. The costs are assigned to each of these work packages or tasks. The sum of these costs is called Planned Value (PV) because they represent the value of the work.
During the execution of the project, the work packages or tasks are completed. The earned value (EV) is then determined from the planned value by, for example
- 100% EV if, the whole task is completed (cautious approach)
- 100% EV when the task has been strarted (optimistic view)
- 50% EV at the beginning and 50% at the end of the task (balanced, but with more effort as you need to book twice)
As EV not necessarily is synchronous with PV, two curves result (marked blue and red). In addition, the real costs (actual costs, AC) are also recorded in the project (green line).
With these three values you can determine a lot about the course of the project and calculate the following KPIs. It is important that the figures are compared at the same project time (e.g. end of month).
Schedule variance (SV).
The plan variance (SV) for the time point x is calculated as follows
SVx = EVx - PVx
If the SVx is greater than zero, this means that the project is ahead of schedule, i.e. progress is greater than originally planned. Conversely, a negative SVx means that the project is lagging behind the plan.
Instead of an absolute KPI, you can also use a relative index (Schedule Variance Index, SPI), which represents the scheduling efficiency.
SPIx = EVx / PVx
A value greater than 1 (or 100%) means that the project is ahead of schedule. Below this, you are in a delay. The advantage of this KPI is that it is very suitable for status reporting (e.g. the project is green if the SPIx value is between 95% and 105%). This ensures that all projects in a portfolio follow the same evaluation criteria.
Cost Variance (CV)
The cost variance calculates the difference between the earned value (EVx) and the actual costs (ACx) and shows whether the project is above or below budget.
CVx = EVx – ACx
If this value is less than zero, it means that the project is running over budget, below that more value is delivered at less cost and the project is therefore under budget. Please note that this key figure does not include the planning value in the calculation, but only refers to the facts actually delivered. The percentage of completion in relation to the current costs. In many control systems, the planned costs are compared (forecast), which is also a possibility, but does not include the delivered work. The KPI in this case would be the forecast variance (FVx).
FVx = PVx - ACx
If the costs in an organization are only posted to a project after the goods have been received, this procedure is not as bad as it appears at first glance. It indicates whether the project is above or below budget and whether there may have been misjudgments regarding cost planning, which of course can also have an influence on the expected progress of the project.
However, since the EVx is determined in the Earned Value Analysis anyway, it should also be used.
Analogous to completion efficiency, cost variance also has a relative KPI, the cost efficiency (CPI).
CPIx = EVx / ACx
This KPI measures the value of work done against actual costs. A value greater than 1 indicates cost savings in the project, while a value less than 1 indicates that the project is more expensive than planned. Similarly, you can use the PVx instead of the EVx.
Advantages / Disadvantages
The method has the advantage that the project progress control is based on measurable and objective criteria. This also ensures that projects can be compared with each other in terms of cost and deadline adherence, which is extremely important within a portfolio. Since the KPIs are collected over several periods, it is also possible to provide better forecasts of the end date and costs.
However, the implementation of Earned Value Analysis is extremely laborious. The costs must be planned and booked according to the Work Breakdown Structure (WBS), which often exceeds the possibilities of the booking system (and also the project manager). Contracts with external suppliers often span several tasks and need to be tracked in more detail than is usually the case. For this reason, implementation attempts often fail.
Implementation the Earned Value Analysis for agile projects.
One way of simplifying the method for implementation is not to refer to individual tasks, but to milestones. Milestones often represent the completion of project phases and thus also the work packages contained therein. The planned value of a project phase therefore corresponds to the costs planned for reaching the milestone.
The PV includes all costs between the last and the next milestone. The same applies to the EV, which is considered reached when the milestone is completed. The current costs (AC) should be determinable from the financial system at any time.
However, if only a few milestones have been planned, the EVA becomes too rough and provides little information for project controlling.
The situation is different for agile projects, where every sprint and/or release can be regarded as a milestone. This means for our EVA key figures.
- PV (Sprint) = Project budget (excluding expenses for project initiation and completion) divided by the number of planned sprints.
- EV (Sprint) = PV (Sprint) x Degree of fulfillment (Sprint)
- AC (Sprint) = measured costs in the sprint

The cost efficiency is calculated by comparing the planned sprint costs with the current degree of completion at the end of the sprint (working increment).
Since sprints always last the same duration, the plan deviation must be considered more differentiated. A value below 100% (or 1) means that the team has overestimated itself, a value above this is theoretically not possible, unless the team has decided to take a story point from the back log into the sprint, which is unusual. In practice, however, they will start with a value below 100% and try to approach 100% scheduling efficiency by constantly improving their effort estimates.
Since it is sufficient to record the current costs here at sprint overall level (and not at task level), the EVA for agile projects can therefore be implemented much more easily than for classic waterfall projects.